Ficheiro:Milankovitch Variations.png
Milankovitch_Variations.png (479 × 363 píxeles; tamaño do ficheiro: 32 kB; tipo MIME: image/png)
| Este ficheiro procede de Wikimedia Commons. A continuación móstrase a información da súa páxina de descrición. Commons é un repositorio libre de ficheiros multimedia. Pode contribuír alí cargando as súas imaxes. |
Resumo
| Descrición |
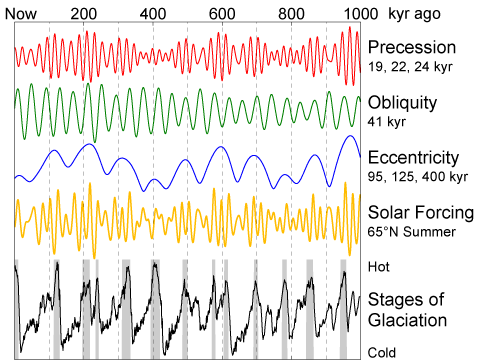
English: This figure shows the variations in Earth's orbit, the resulting changes in solar energy flux at high latitude, and the observed glacial cycles.
According to Milankovitch Theory, the precession of the equinoxes and the apsides, variations in the tilt of the Earth's axis (obliquity) and changes in the eccentricity of the Earth's orbit are responsible for causing the observed 100 kyr cycle in ice ages by varying the amount of sunlight received by the Earth at different times and locations, particularly high northern latitude summer. These changes in the Earth's orbit are the predictable consequence of interactions between the Earth, its moon, and the other planets. The orbital data shown are from Quinn et al. (1991). Principal frequencies for each of the three kinds of variations are labeled. The solar forcing curve (aka "insolation") is derived from July 1st sunlight at 65 °N latitude according to Jonathan Levine's insolation calculator [1]. The glacial data are from Lisiecki and Raymo (2005) and gray bars indicate interglacial periods, defined here as deviations in the 5 kyr average of at least 0.8 standard deviations above the mean. |
| Data | 11 de febreiro de 2006 (data do carregamento) |
| Orixe | Obra propia |
| Autoría | This image was produced by Robert A. Rohde from publicly available data, and is incorporated into the Global Warming Art project. |
| Outras versións | Obras derivadas deste ficheiro: Variacions de Milankovitch.png |
References
- Lisiecki, L. E., and M. E. Raymo (2005), "A Pliocene-Pleistocene stack of 57 globally distributed benthic δ18O records." Paleoceanography 20, PA1003, doi:10.1029/2004PA001071 (alternative full text link: [2]).
- Quinn, T. R., S. Tremaine, and M. Duncan (1991), "A Three Million Year Integration of the Earth's Orbit." The Astronomical Journal 101, pp. 2287-2305, doi:10.1086/115850.

|
Esta imaxe (ou todas as imaxes deste artigo ou categoría) deberían volverse crear como imaxes vectoriais SVG. Isto proporciona moitas vantaxes, véxase Commons:Media for cleanup (en inglés) para máis información. Se xa hai unha versión SVG desta imaxe dispoñible, por favor, cárguea en Commons. Tras subila, substitúa este modelo polo modelo {{vector version available|novo nome da imaxe.svg}} nesta imaxe.
|
Licenza

|
Autorízase a copia, distribución e/ou modificación deste documento baixo os termos da licenza de documentación libre GNU, versión 1.2 ou calquera outra que posteriormente publique a Free Software Foundation; sen seccións invariables, textos de portada, nin textos de contraportada. Inclúese unha copia da devandita licenza na sección titulada GNU Free Documentation License. |
| Este ficheiro está licenciado baixo a licenza Creative Commons recoñecemento compartir igual 3.0 sen adaptar. | ||
| ||
| A etiqueta desta licenza engadiuse a este ficheiro como parte da actualización da licenza GFDL. |
Historial do ficheiro
Prema nunha data/hora para ver o ficheiro tal e como estaba nese momento.
| Data/Hora | Miniatura | Dimensións | Usuario | Comentario | |
|---|---|---|---|---|---|
| actual | 11 de febreiro de 2006 ás 11:35 | | 479 × 363 (32 kB) | David Legrand | == Description == This figure shows the variations in Earth's orbit, the resulting changes in solar energy flux at high latitude, and the observed glacial cycles. According to Milankovitch Theory, the precession of the [[ |
Uso do ficheiro
A seguinte páxina usa este ficheiro:
Uso global do ficheiro
Os seguintes wikis empregan esta imaxe:
- Uso en af.wikipedia.org
- Uso en ar.wikipedia.org
- Uso en be.wikipedia.org
- Uso en bg.wikipedia.org
- Uso en ca.wikipedia.org
- Uso en da.wikipedia.org
- Uso en de.wikipedia.org
- Uso en de.wikiversity.org
- Uso en el.wikipedia.org
- Uso en en.wikipedia.org
- Uso en es.wikipedia.org
- Uso en fa.wikipedia.org
- Uso en fi.wikipedia.org
- Uso en fr.wikipedia.org
- Uso en fy.wikipedia.org
- Uso en hu.wikipedia.org
- Uso en hy.wikipedia.org
- Uso en id.wikipedia.org
- Uso en ja.wikipedia.org
- Uso en ko.wikipedia.org
- Uso en nl.wikipedia.org
Ollar o uso global deste ficheiro.