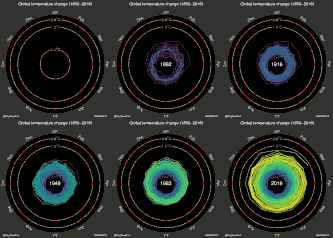
#!/usr/bin/python3
# -*- coding: utf8 -*-

import calendar
import matplotlib as mpl
import matplotlib.pyplot as plt
import numpy as np
import os
from math import *

plt.rc('mathtext', default='regular')

data_filename = "HadCRUT.4.6.0.0.monthly_ns_avg.txt"

if not os.path.isfile(data_filename):
    print("need raw data from https://www.metoffice.gov.uk/hadobs/hadcrut4/index.html")
    exit()

year_month_T = []
with open(data_filename, "r") as df:
    for l in df.readlines():
        l = l.strip().split()
        year_month_T.append([int(l[0].split("/")[0]), int(l[0].split("/")[1]), float(l[1])])

years, months, T = [np.array(i) for i in zip(*year_month_T)]
T_baseline = np.mean(T[np.logical_and(years >= 1850, years <= 1900)])
T -= T_baseline
angles = -(months-1) / 12. * 2 * pi
points = np.vstack((angles, T)).T
n = len(points)

fig = plt.figure(figsize=(5, 5.4))
fig.patch.set_facecolor('#333333')
cmap = plt.cm.get_cmap('viridis')
ax = fig.add_axes([0.07, 0.07, 0.86, 0.8], projection="polar", axisbg="k")
ax.set_theta_zero_location("N")
r0, r1 = -1., 2.3
ax.set_ylim(r0, r1)

ax.add_artist(mpl.patches.Arc((0, 0), 2*(0-r0), 2*(0-r0), transform=ax.transData._b,
    theta1=90+20, theta2=90-20, color="white", lw=1.8))
ax.add_artist(mpl.patches.Arc((0, 0), 2*(1.5-r0), 2*(1.5-r0), transform=ax.transData._b,
    theta1=90+10, theta2=90-10, color="red", lw=1.8))
ax.add_artist(mpl.patches.Arc((0, 0), 2*(2-r0), 2*(2-r0), transform=ax.transData._b,
    theta1=90+8, theta2=90-8, color="red", lw=1.8))
ax.text(0, 0.0, r"$0^\circ C$", color="white",
    ha='center', va="center", fontsize=10, zorder=-1)
ax.text(0, 1.5, r"$1.5^\circ C$", color="red",
    ha='center', va="center", fontsize=10, zorder=-1)
ax.text(0, 2.0, r"$2.0^\circ C$", color="red",
    ha='center', va="center", fontsize=10, zorder=-1)

# note: replotting each time is slow, could be faster if figure was kept.
for i, (start, stop) in enumerate(zip(points[:iframe], points[1:iframe+1])):
    x, y = zip(start, stop)
    ax.plot(x, y, color=cmap(i /n))

ax.get_yaxis().set_visible(False)
ax.set_xticks(np.radians(np.arange(0, -360, -30)))
ax.set_xticklabels([calendar.month_abbr[i+1] for i in range(12)], color="#cccccc")
for i, tick in enumerate(ax.get_xticklabels()):
    tick.set_rotation(-30 * i)
ax.grid(False)

fig.suptitle(u"Global temperature change (%s\u2013%s)" % (min(years), max(years)),
    color="white")
fig.text(0.96, 0.02, 'HadCRUT4', ha='right', va='bottom', color="white", fontsize=8)
#ax.text(0, r0, str(years[iframe]), color="white", ha='center', va="center", fontsize=12)

plt.savefig("Temperature_spiral_HadCRUT4.svg",
    facecolor=fig.get_facecolor(), edgecolor="none")


