Ficheiro:1850- Warming stripes - global average surface temperature.svg

Tamaño desta vista previa en PNG do ficheiro en formato SVG: 800 × 450 píxeles. Outras resolucións: 320 × 180 píxeles | 640 × 360 píxeles | 1.024 × 576 píxeles | 1.280 × 720 píxeles | 2.560 × 1.440 píxeles | 1.200 × 675 píxeles.
Ficheiro orixinal (ficheiro SVG; resolución de 1.200 × 675 píxeles; tamaño do ficheiro: 10 kB)
| Este ficheiro procede de Wikimedia Commons. A continuación móstrase a información da súa páxina de descrición. Commons é un repositorio libre de ficheiros multimedia. Pode contribuír alí cargando as súas imaxes. |
Resumo
| Descrición |
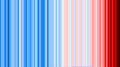
English: Warming stripes graphic showing global average surface temperature starting in 1850
|
| Data | |
| Orixe | Obra propia |
| Autoría | RCraig09 |
Related files
-
 20190705 Warming stripes - Berkeley Earth (world) - avg above- and below-ice readings.png — PNG predecessor: Since this 2019 upload, global temperatures have risen and broken the red color scale on the upside.
 -
 20240311 Warming stripes BEHIND line chart - global surface temperature.svg —
uses the present chart as background, behind the line chart
_-_avg_above-_and_below-ice_readings.png)

Licenza
Eu, como posuidor dos dereitos de autor desta obra, pola presente publícoa baixo a seguinte licenza:
Este ficheiro está licenciado baixo a licenza Creative Commons recoñecemento compartir igual 4.0 internacional.
- Vostede é libre de:
- compartir – copiar, distribuír e difundir a obra
- facer obras derivadas – adaptar a obra
- Baixo as seguintes condicións:
- recoñecemento – Debe indicar a debida atribución de autoría, fornecer unha ligazón á licenza e indicar se se realizaron cambios. Pode facer isto de calquera forma razoable, mais non nunha forma que indique que quen posúe a licenza apoia ou subscribe o seu uso da obra.
- compartir igual – Se altera, transforma ou amplía este contido, debe publicar as súas contribucións baixo a mesma licenza ou outra compatible á orixinal.
Historial do ficheiro
Prema nunha data/hora para ver o ficheiro tal e como estaba nese momento.
| Data/Hora | Miniatura | Dimensións | Usuario | Comentario | |
|---|---|---|---|---|---|
| actual | 12 de marzo de 2024 ás 04:58 | | 1.200 × 675 (10 kB) | RCraig09 | Uploaded own work with UploadWizard |
Uso do ficheiro
A seguinte páxina usa este ficheiro:
Uso global do ficheiro
Os seguintes wikis empregan esta imaxe:
- Uso en en.wikipedia.org
- Uso en eo.wikipedia.org
- Uso en it.wikipedia.org
- Uso en ro.wikipedia.org
- Uso en uk.wikipedia.org