Ficheiro:1000 Year Temperature Comparison.png

1000_Year_Temperature_Comparison.png(599 × 442 píxeles; tamaño do ficheiro: 32 kB; tipo MIME: image/png)

Esta imaxe (ou todas as imaxes deste artigo ou categoría) deberían volverse crear como imaxes vectoriais SVG. Isto proporciona moitas vantaxes, véxase Commons:Media for cleanup (en inglés) para máis información. Se xa hai unha versión SVG desta imaxe dispoñible, por favor, cárguea en Commons. Tras subila, substitúa este modelo polo modelo {{vector version available|novo nome da imaxe.svg}} nesta imaxe.

Resumo

Descrición
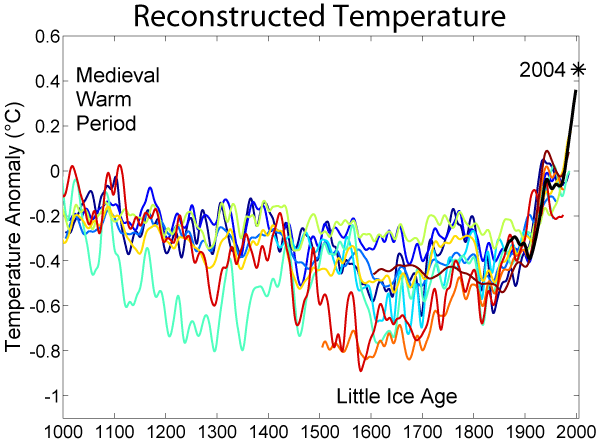
English: This image is a comparison of 10 different published reconstructions of mean temperature changes during the 2nd millennium. More recent reconstructions are plotted towards the front and in redder colors, older reconstructions appear towards the back and in bluer colors. An instrumental history of temperature is also shown in black. The medieval warm period and little ice age are labeled at roughly the times when they are historically believed to occur, though it is still disputed whether these were truly global or only regional events. The single, unsmoothed annual value for 2004 is also shown for comparison. (Image:Instrumental Temperature Record.png shows how 2004 relates to other recent years).

It is unknown which, if any, of these reconstructions is an accurate representation of climate history; however, these curves are a fair representation of the range of results appearing in the published scientific literature. Hence, it is likely that such reconstructions, accurate or not, will play a significant role in the ongoing discussions of global climate change and global warming.

For each reconstruction, the raw data has been decadally smoothed with a σ = 5 yr Gaussian weighted moving average. Also, each reconstruction was adjusted so that its mean matched the mean of the instrumental record during the period of overlap. The variance (i.e. the scale of fluctuations) was not adjusted (except in one case noted below).

Except as noted below, all original data for this comparison comes from here and links therein. It should also be noted that many reconstructions of past climate report substantial error bars, which are not represented on this figure.
Data
Orixe http://www.globalwarmingart.com/wiki/File:1000_Year_Temperature_Comparison.png
Autoría Robert A. Rohde
Outras versións

Reconstructions

The reconstructions used, in order from oldest to most recent publication are:

  1. (dark blue 1000-1991): The Holocene.
  2. (blue 1000-1980): Geophysical Research Letters.
  3. (light blue 1000-1965): Ambio. Modified as published in Science.
  4. (lightest blue 1402-1960): J. Geophys. Res..
  5. (light green 831-1992): Science.
  6. (yellow 200-1980): Geophysical Research Letters. doi:10.1029/2003GL017814.
  7. (orange 200-1995): Reviews of Geophysics. doi:10.1029/2003RG000143
  8. (red-orange 1500-1980): Geophys. Res Lett.. doi:10.1029/2004GL019781
  9. (red 1-1979): Nature. doi:10.1038/nature03265
  10. (dark red 1600-1990): Science. doi:10.1126/science.1107046

(black 1856-2004): Instrumental data was jointly compiled by the Climatic Research Unit and the UK Meteorological Office Hadley Centre. Global Annual Average data set TaveGL2v [1] was used.

Documentation for the most recent update of the CRU/Hadley instrumental data set appears in: Journal of Climate.

Licenza

The original version of this figure was prepared by Robert A. Rohde from publicly available data and is incorporated into the Global Warming Art project.

Image from Global Warming Art
This image is an original work created for Global Warming Art. Please refer to the Year Temperature Comparison.png image description page for more information.
GNU head Autorízase a copia, distribución e/ou modificación deste documento baixo os termos da licenza de documentación libre GNU, versión 1.2 ou calquera outra que posteriormente publique a Free Software Foundation; sen seccións invariables, textos de portada, nin textos de contraportada. Inclúese unha copia da devandita licenza na sección titulada GNU Free Documentation License.
w:gl:Creative Commons
recoñecemento compartir igual
Este ficheiro está licenciado baixo a licenza Creative Commons recoñecemento compartir igual 3.0 sen adaptar.
Vostede é libre de:
  • compartir – copiar, distribuír e difundir a obra
  • facer obras derivadas – adaptar a obra
Baixo as seguintes condicións:
  • recoñecemento – Debe indicar a debida atribución de autoría, fornecer unha ligazón á licenza e indicar se se realizaron cambios. Pode facer isto de calquera forma razoable, mais non nunha forma que indique que quen posúe a licenza apoia ou subscribe o seu uso da obra.
  • compartir igual – Se altera, transforma ou amplía este contido, debe publicar as súas contribucións baixo a mesma licenza ou outra compatible á orixinal.
A etiqueta desta licenza engadiuse a este ficheiro como parte da actualización da licenza GFDL.


Notes

  1. Data from Moberg et al. was taken directly from the supplemental information accompanying the Nature article.
  2. Data for Oerlemans was provided by William M. Connolley.
  3. Esper et al. reported only fluctuations in "arbitrary" units, so the variance in this record was rescaled to match the variance during the period of overlap with the instrumental record.
  4. When a paper included multiple reconstructions, the global annually average temperature data was used. If this was not reported, then Northern Hemisphere annually averaged data was used.
  5. Four records appearing at [2] were not used in preparing this graph for the following reasons:
    1. Mann et al. 98 was not included because Mann et al. 99 extended and updated that record.
    2. Briffa et al. 98 was not included because Briffa et al. 2001 extended and updated that record.
    3. Pollack et al. 98 was not included because the reported data was not found to be in a form that allowed for easy replotting.
    4. Mann et al. 2000 was not used because it did not include an original reconstruction covering at least the Northern Hemisphere.


Dragons flight's Temperature Record Series
This figure is part of a series of plots created by Dragons flight to illustrate
changes in Earth's temperature and climate across many different time scales.
Time Period: 25 yrs | 150 yrs | 1 kyr | 2 kyr | 12 kyr | 450 kyr | 5 Myr | 65 Myr | 500 Myr
For articles related to this topic see: Temperature record

Pés de foto

Engada unha explicación dunha liña do representa este ficheiro

Elementos retratados neste ficheiro

representa a

896104465de636e551cb77de82d0892e1e892551

tamanho dos dados portugués

32.749 Byte

442 píxel

599 píxel

Historial do ficheiro

Prema nunha data/hora para ver o ficheiro tal e como estaba nese momento.

Data/HoraMiniaturaDimensiónsUsuarioComentario
actual21 de novembro de 2019 ás 23:14Miniatura da versión ás 23:14 do 21 de novembro de 2019599 × 442 (32 kB)MyridiumSomebody updated the image with a "2016" label that isn't even included in the data analysed! Data analysed only goes up to 2004.
5 de maio de 2019 ás 06:54Miniatura da versión ás 06:54 do 5 de maio de 2019599 × 500 (48 kB)TobusUpdate to show 2016 temperature anomaly
16 de xullo de 2014 ás 17:10Miniatura da versión ás 17:10 do 16 de xullo de 2014599 × 442 (32 kB)JeffyPShrinkin' the image.
17 de decembro de 2005 ás 22:51Miniatura da versión ás 22:51 do 17 de decembro de 2005599 × 442 (40 kB)Saperaud~commonswiki*'''Description:''' [[en:Image:{{subst:PAGENAME}}]]

A seguinte páxina usa este ficheiro:

Uso global do ficheiro

Os seguintes wikis empregan esta imaxe: